JUNE 2024 UPDATE

Based on MMI's latest data, the following benchmarks provide mortgage industry professionals with a quick snapshot of current mortgage production trends. All monthly benchmarks reflect production data from June 2024.
Want to learn how your business can access this type of data from MMI?

Lenders
For comparative purposes, MMI divides national lenders into three tiers based on their rolling 12-month production volume. The tiered rankings are:
-
Prime >$5B
- Capital $500M-$5B
-
Select $50-500M
The following data represents production from June 2024.
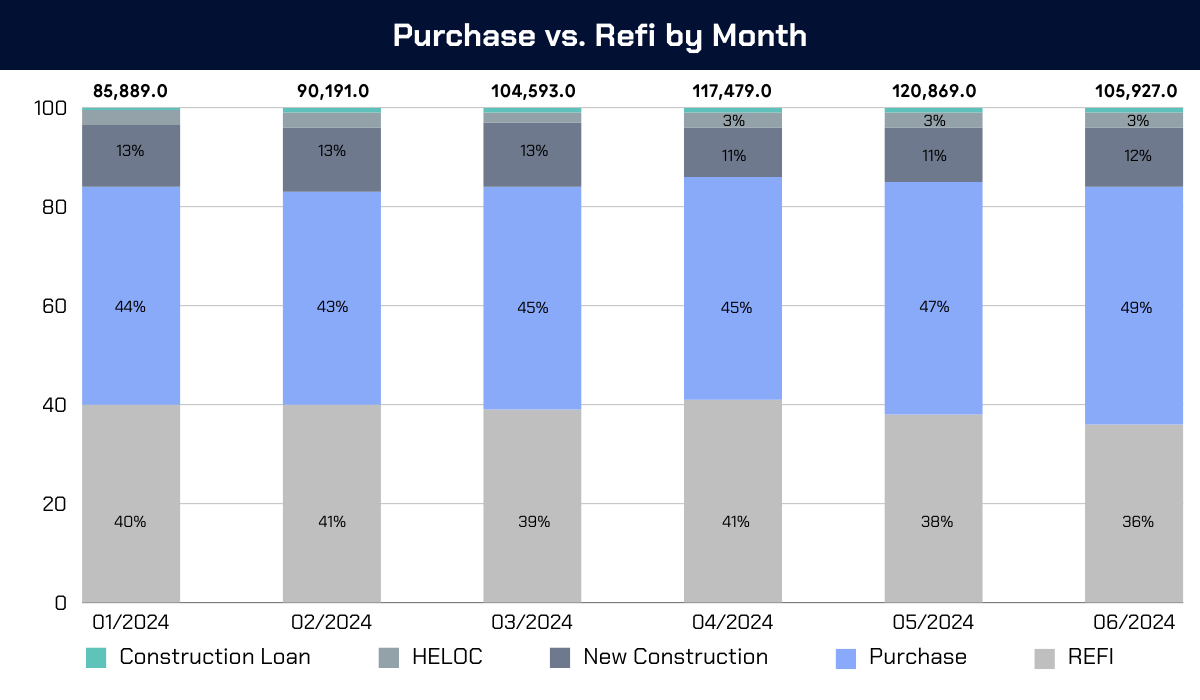
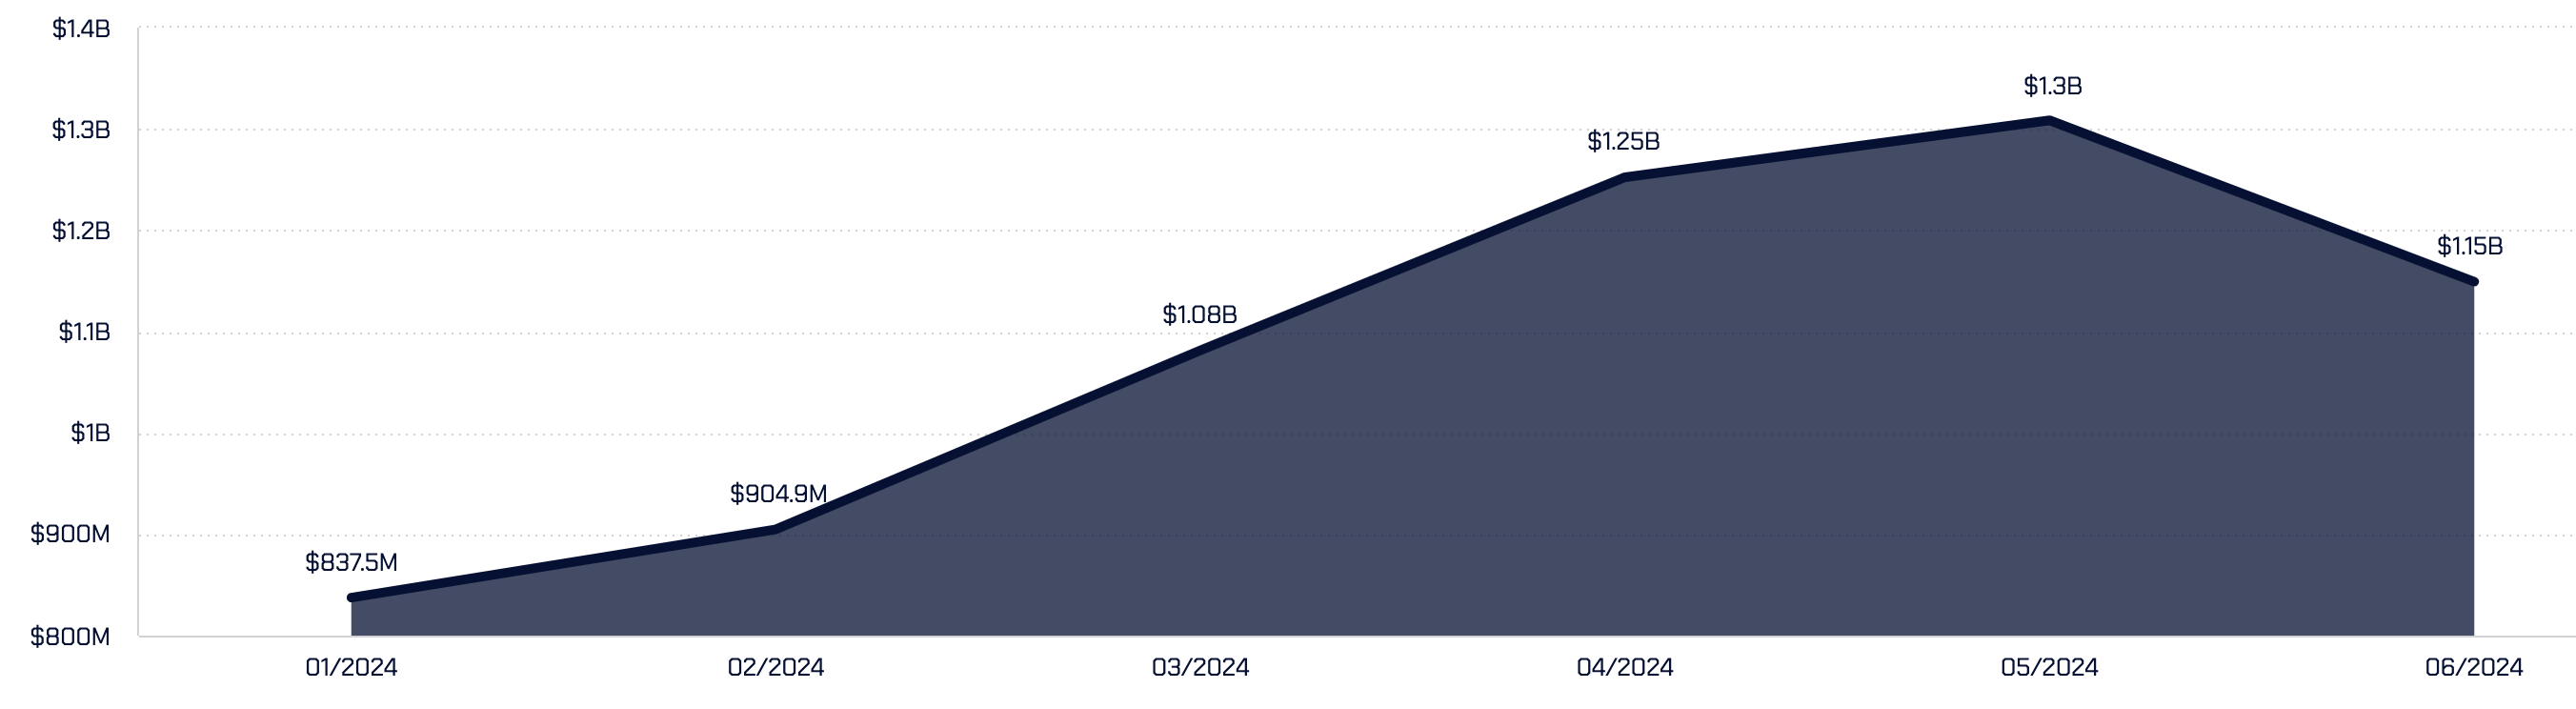
PRIME TIER
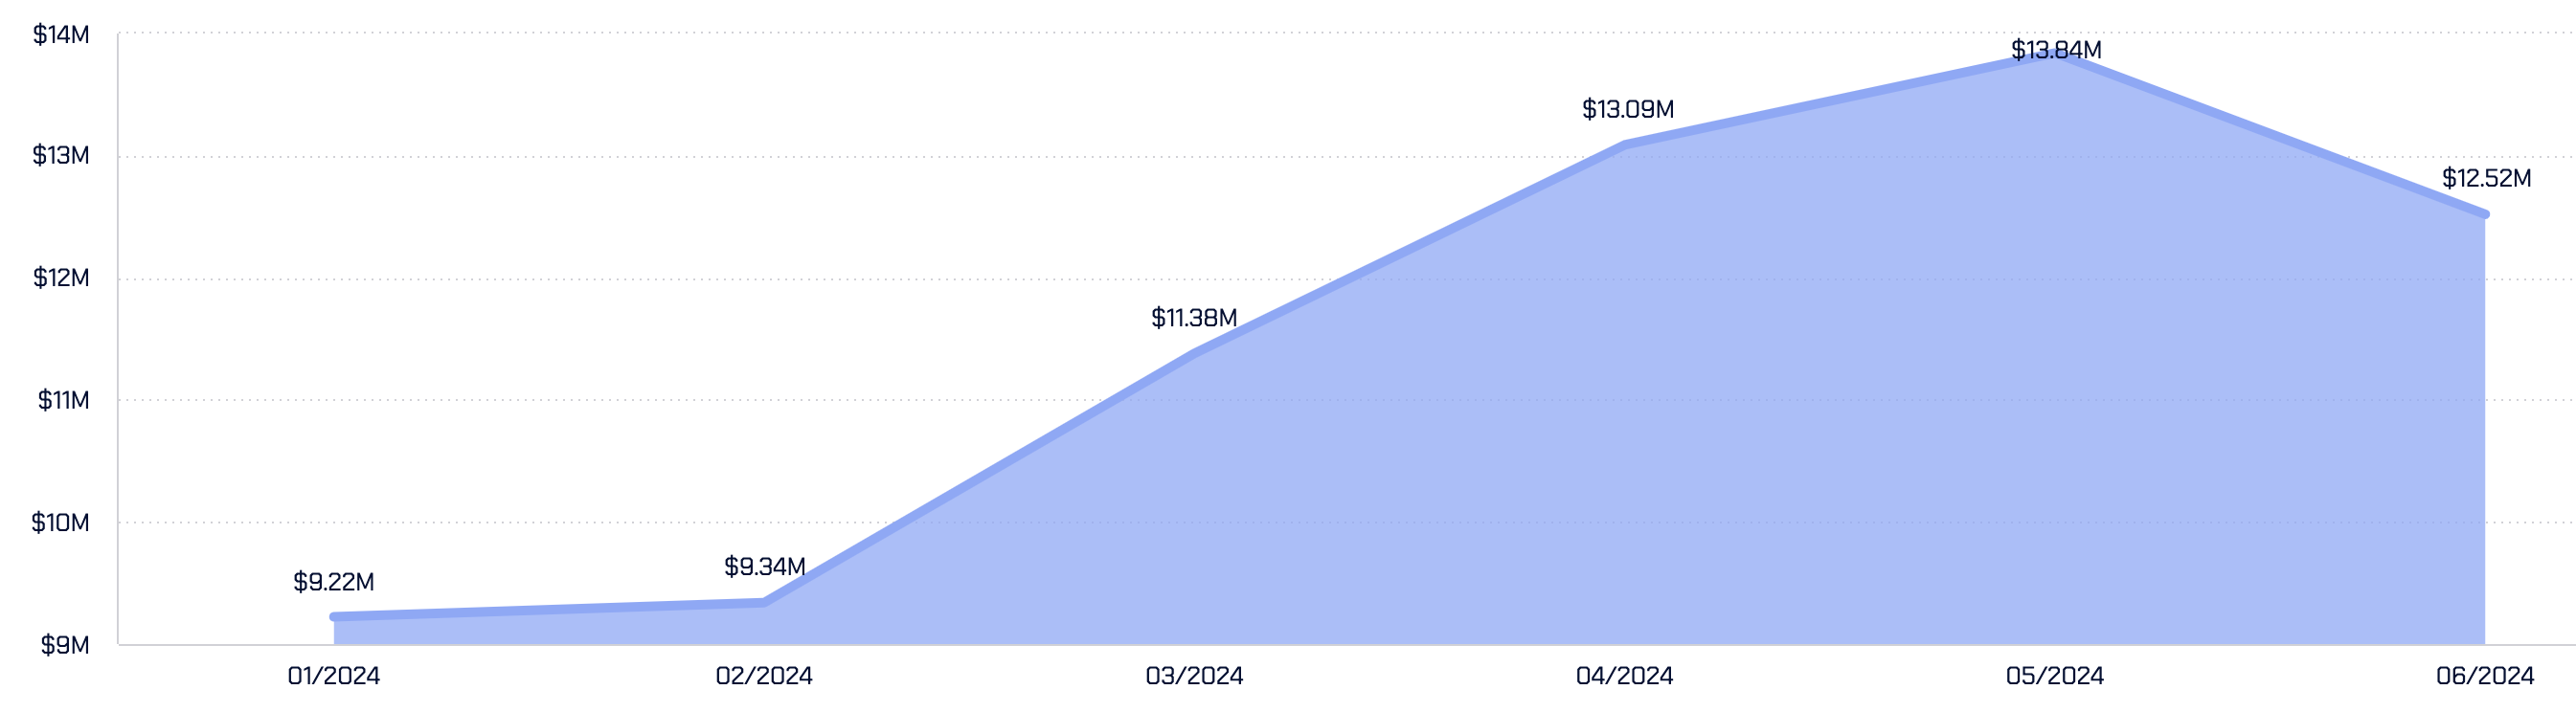
Avg Production Prior Month
$1.1B
Avg Transaction Count: 3,135.2
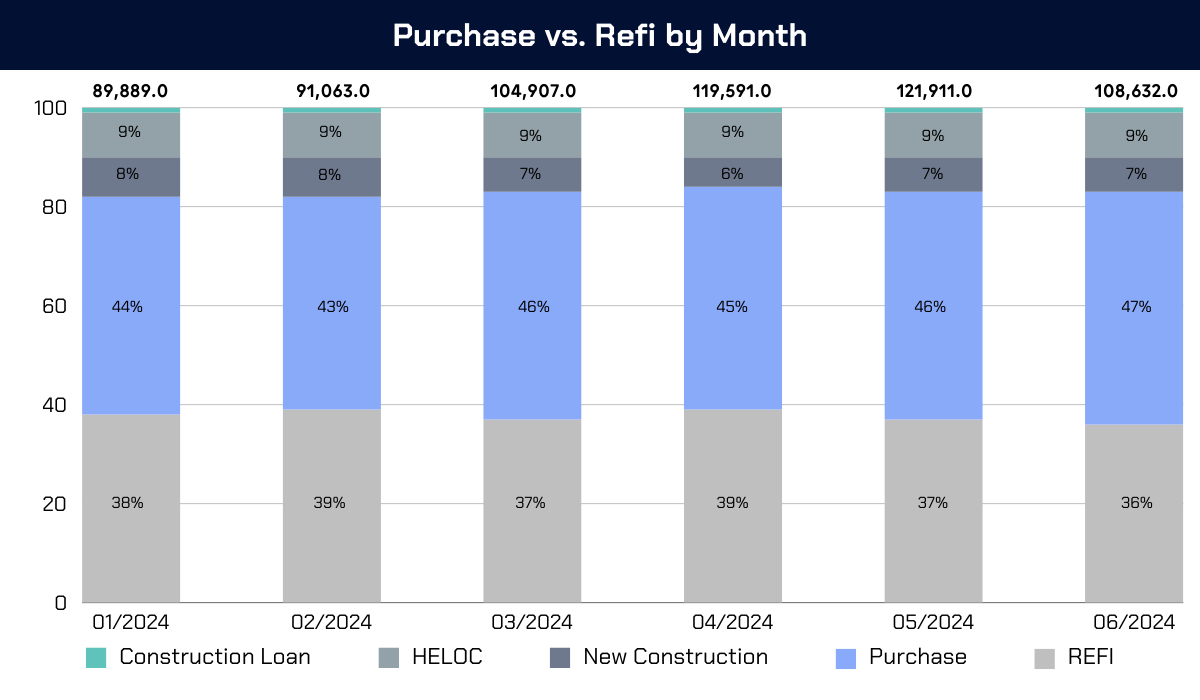
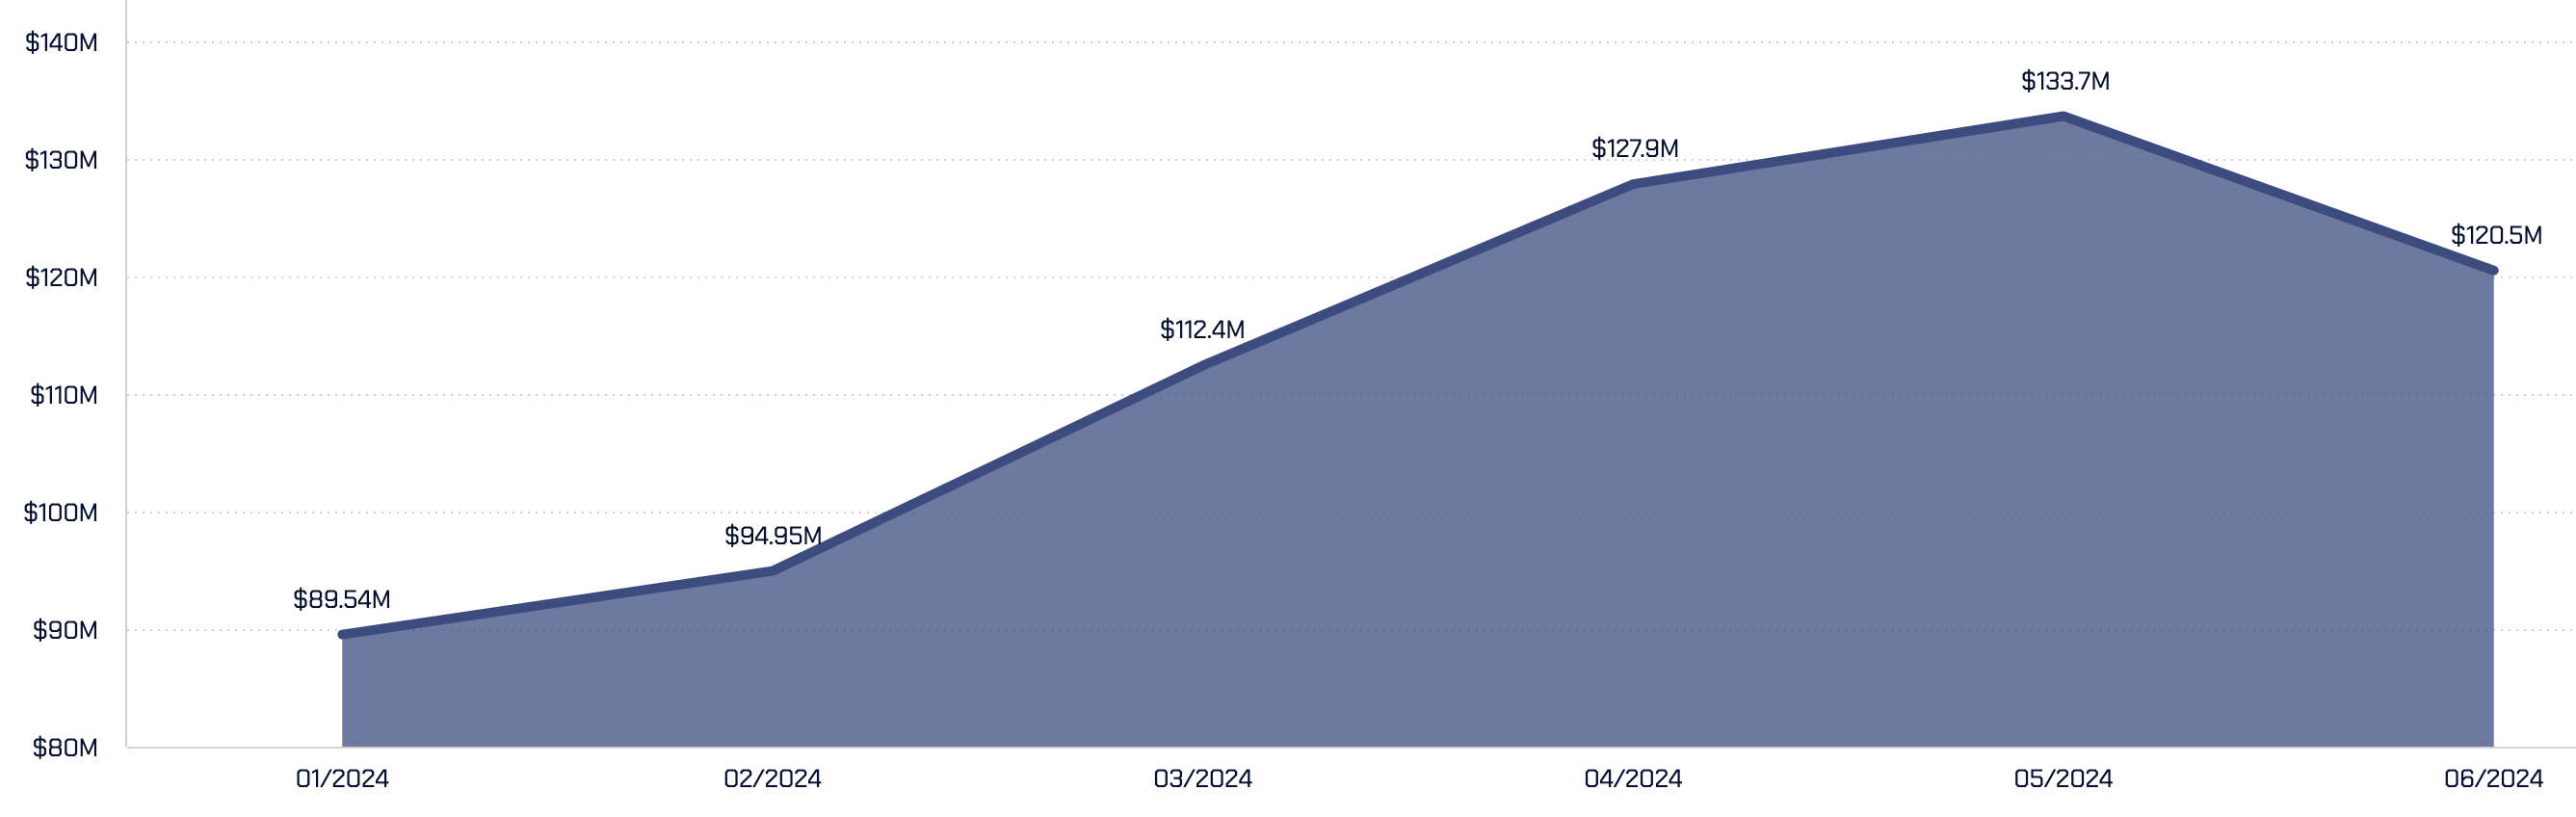
CAPITAL TIER
Avg Production Prior Month
$120.5M
Avg Transaction Count: 359.9
SELECT TIER
Avg Production Prior Month
$12.5M
Avg Transaction Count: 38.6
Up Close: Prime Tier
GROWTH/LOSS
% Change from Prev Month
-12.2%
Transaction Count: -13.4%
DEAL SIZES
Average Deal Size
$434.2K
Median Deal Size: $294,192
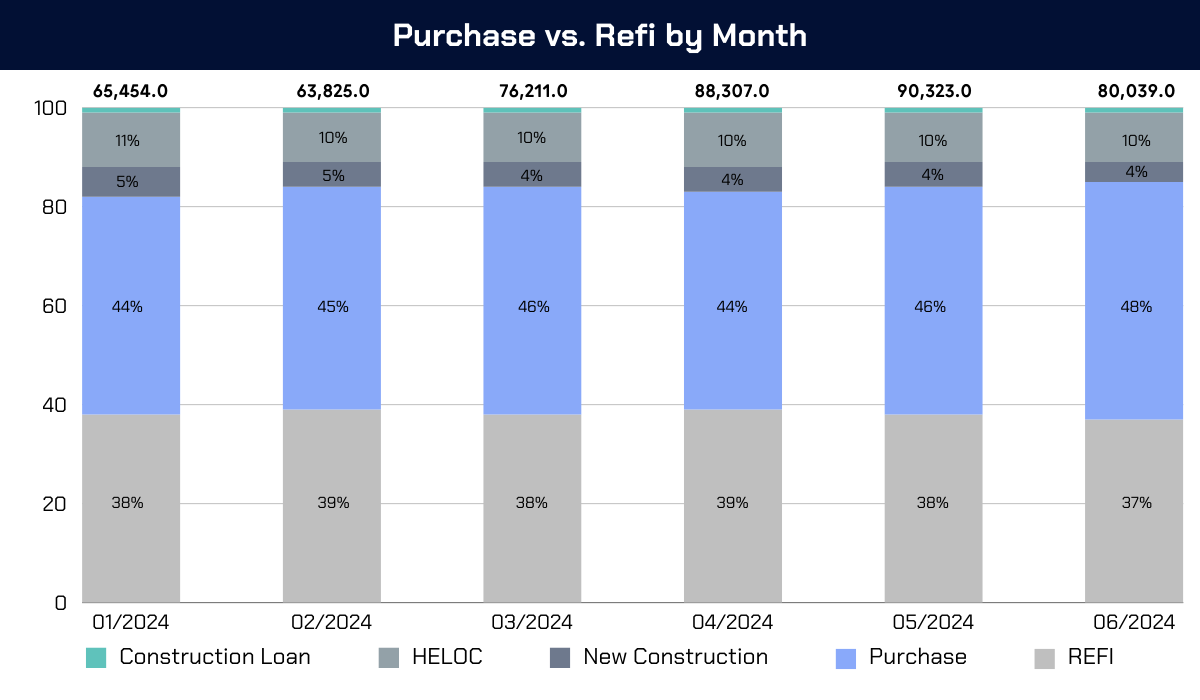
TRANSACTION TYPES
% Purchase
49%
Up Close: Capital Tier
GROWTH/LOSS
% Change from Prev Month
-9.8%
Transaction Count: -11.7%
DEAL SIZES
Average Deal Size
$382.2K
Median Deal Size: $277,343
TRANSACTION TYPES
% Purchase
47%
Want more data like this?
Up Close: Select Tier
GROWTH/LOSS
% Change from Prev Month
-9.5%
Transaction Count: -11.7%
DEAL SIZES
Average Deal Size
$415.3K
Median Deal Size: $260,000
TRANSACTION TYPES
% Purchase
48%
Loan Officers
MMI divides loan officers into six ranking tiers for comparative purposes based on their rolling 12-month production volume. Loan officers producing under $2M are unranked. The following data represents loan officer production for June 2024.
LOAN OFFICER DEALS
Avg $ in Production
$1.2M
Avg. # of Deals: 3.53
DEAL SIZES
Average Deal Size
$360.5K
Median Deal Size: $290.0K
TRANSACTION TYPES
% Purchase
46.9%
LO Tiers
Avg Prod
Avg Deals #
% Change
LO Tiers
Avg Prod Volume
Avg Deals #
% Change
Unicorn
>$100M annual
$13.68M
19.8
-12.8%
Diamond
$50-100M
$6.01M
12.7
-9.2%
Platinum
$20-50M
$2.69M
7.3
-10.2%
Gold
$10-20M
$1.38M
4.2
-8.6%
Silver
$5-10M
$809.5K
2.7
-7.4%
Bronze
$2-5M
$532.0K
1.9
-3.7%
Regional Trends
The following growth and decline for states and counties represent purchase and construction production volume variance between May and June 2024.
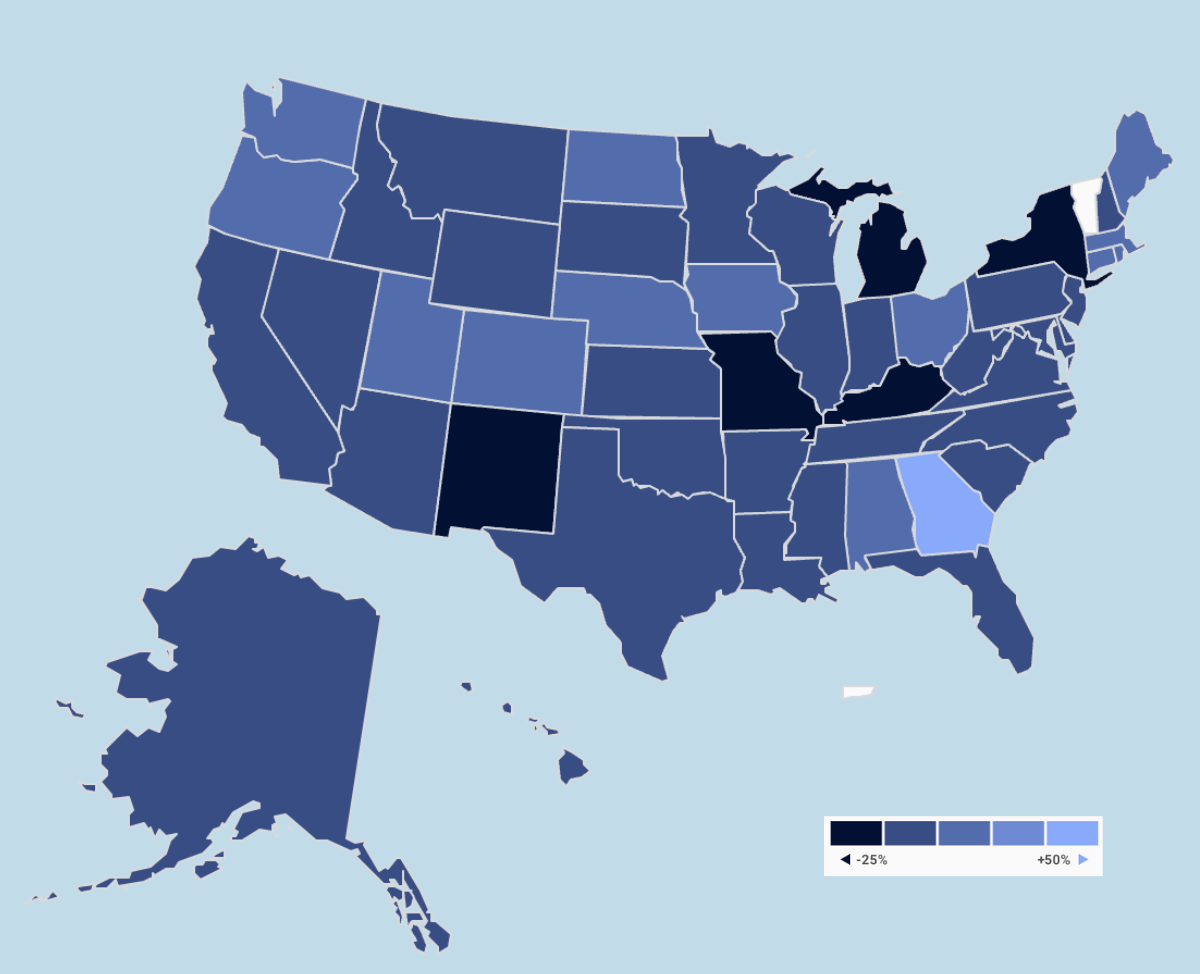
Top 5 Rising States
STATE
PROD VOL
CHANGE
Georgia
$1.38B
+56.92%
Connecticut
$992.2M
+13.52%
Oregon
$1.43B
+12.84%
Massachusetts
$2.9B
+12.46%
Ohio
$2.34B
+9.76%
Top 5 Falling States
STATE
PROD VOL
CHANGE
Michigan
$900.8M
-25.35%
New Mexico
$321.5M
-25.73%
Kentucky
$409.3M
-29.74%
New York
$1.31B
-31.52%
Missouri
$483.2M
-36.32%
Top 10 Hottest Counties
COUNTY
GROWTH
Canyon County, ID
+372.73%
Fulton County, GA
+182.59%
Tulsa County, OK
+116.73%
Johnson County, IA
+107.27%
Marion County, OR
+104.50%
Delaware County, OH
+102.42%
Henry County, GA
+88.28%
Dallas County, IA
+81.79%
Utah County, UT
+71.13%
DeKalb County, GA
+69.63%